Utility Stock 3-5 Year Total Return Guidance Table
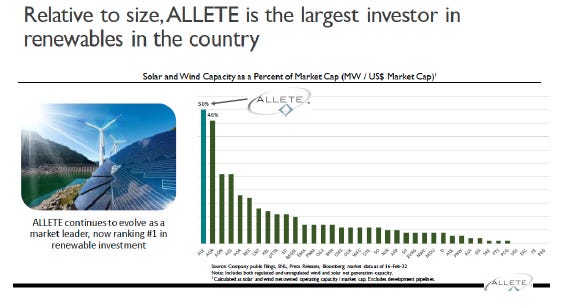
We like to follow utility stocks because they are at the forefront of the entire ESG mandates and energy transition. They are also typically involved in electric vehicles, charging stations, wind power (on and offshore), solar, hydrogen, LNG, power distribution and transmission, coal plant retirements, nuclear (including SMRs) plants, natural gas plants and distribution and They typically have detailed presentations and many have had Investor Days in the last few months or have one coming up. The areas covered in these presentations are all similar so it is helpful when trying to understand the strengths and weakness of each utility on a relative basis. It is difficult for general analysts like us to think we have any real edge relative to analysts in this space. There are many nuances to investing in this industry that we don’t really have any edge on. But we would encourage any investor that is investing in oil and gas companies or nuclear investments or anything related to electric cars, wind, solar, hydrogen or large scale batteries, to spend a couple of days reading the utility presentations. We believe utility presentations are a great source of industry data across all aspects of the Green Energy Technologies spectrum. We think you will gain insights into how far along (or not) many of the technologies are.
One thing we noticed was how narrow the range of EPS growth guidance issued by all the utilities are. A growth rate of 5-7% is by far the most popular range. Perhaps that is a function of the fact that most of the utilities are restricted by PUCs in what they can earn on their equity and the ranges are very narrow (8-11%).
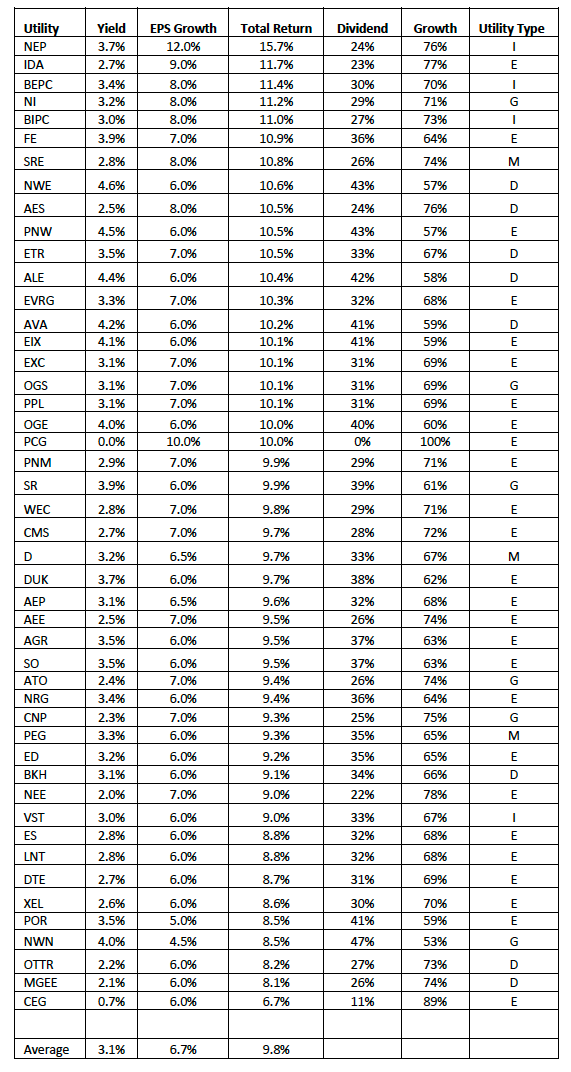
We have ranked the utilities by their estimated total return over the next 2-4 years. The total return calculation is simply the current yield + Mid range of EPS guidance. Of course there are huge limitations to this ranking and there is no guarantee these rates of return will be achieved, But it is a good starting point for investors looking for some diversification.
Some of the limitations of the ranking are as follows:
No evaluation of the regulatory risks and any estimates as to the result of pending rate cases (positive or negative).
No consideration as to how accurate the estimated rate base growth will be. Rate base grow is one of the most important factors that drive EPS growth guidance. Utilities vary widely in terms of their exposure to residential, commercial and industrial customer mix.
Another factor to consider is how much equity issuance (if any) is required to help fund the rate base growth and the chances that more or less equity will be required.
We didn’t look at the power generation mix between coal, wind, solar, hydro, nat gas and the expected growth in the various segments (or estimated costs)
We also haven’t looked closely at the population growth in each utility’s service area.
We haven’t looked at potential changes in debt ratings or refinancings or which utilities might have more interest rate risk than others.
We haven’t looked closely at pension funding status.
We didn’t adjust for customer mix between commercial, industrial and residential.
We haven’t lumped similar utilities (gas, electric, LDC, independent, etc.).
Below is the table we have compiled for investors to use as a starting point. The numbers are probably not 100% accurate, but we think that on a relative basis the ranking of total return is pretty close.
Utilities Ranked By Estimated 2-4 Year Total Return Guidance
Interesting findings/trends
There is a tremendous amount of industry data and projections you can get from looking at a lot of utility presentations that are helpful for investors in non-utility industries.
All the utility presentations have 3-20 pages on how they are doing on ESG. A typical utility earnings presentation is 30-50 pages and an Investor Day presentation can run 75-120 pages!!
Undergrounding and hardening of utility power lines and assets is becoming a significant focus of utilities on the coasts (Trying to reduce chances of power outages and equipment/powerline destruction due to hurricanes and other severe storms).
O&M costs are coming down across the board.
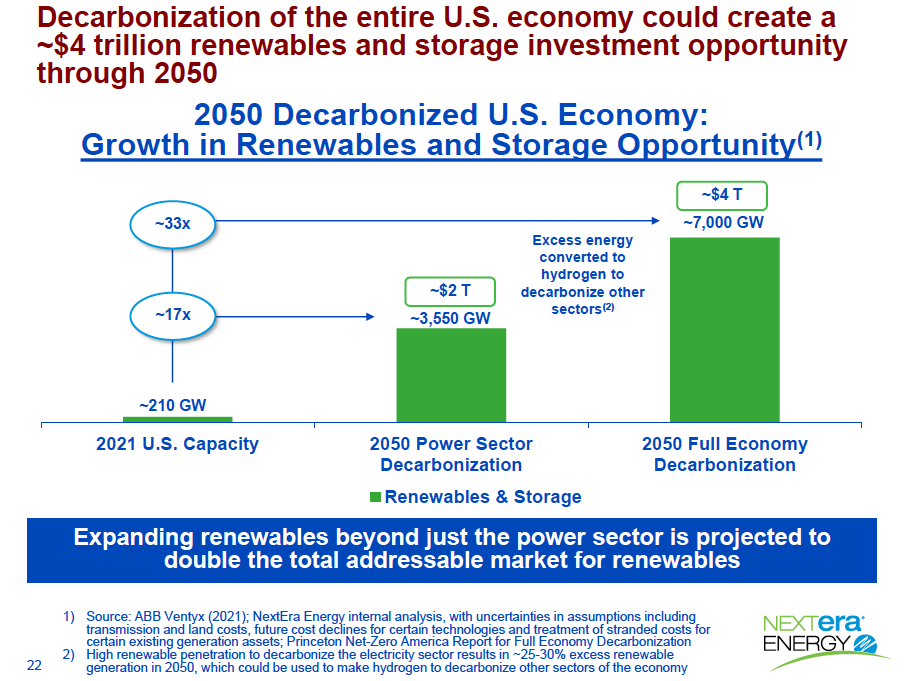
All utilities are decarbonizing and most have explicit goals on becoming net zero by 2035-2050. Typical Example:
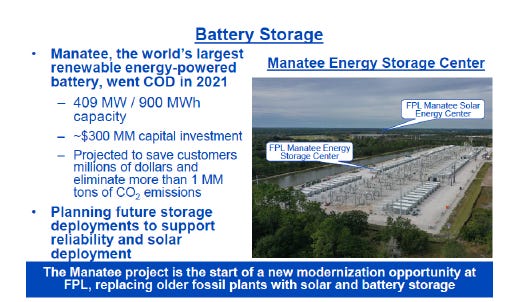
Large scale battery storage is being implemented today and there is an increased focus on investments in carbon capture, LNG and hydrogen.
Most have financial breakdowns of future investments in the various categories of renewable, transmission, distribution, IT, upgrading grid.
Most have slides showing service areas and locations of wind/solar/hydro/etc. assets. The nerds in us love these slides.
Good slide for generalists to understand some of the risks.
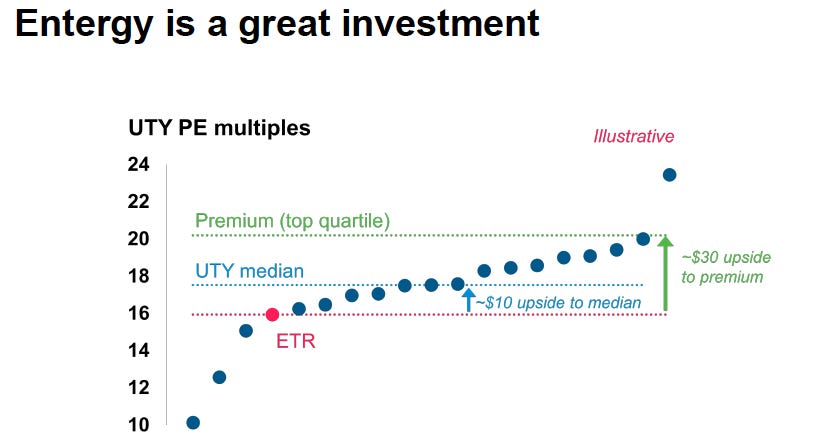
Utilities like to compare themselves to other utilities when convenient.


